Consumer Digest: September 2022

Welcome to the September of the Consumer Digest, where we aim to provide relevant, informative and actionable insights around consumer trends. This month, we're highlighting different ways customers are responding to inflation. We're also taking a closer look into plant-based trends and how shoppers plan to change their meal habits this fall.
Shopper Concern – Signs of Optimism
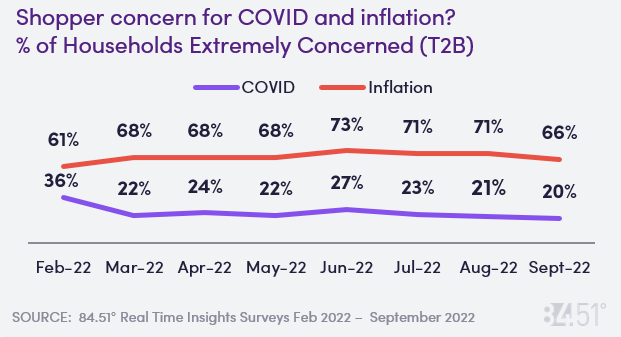
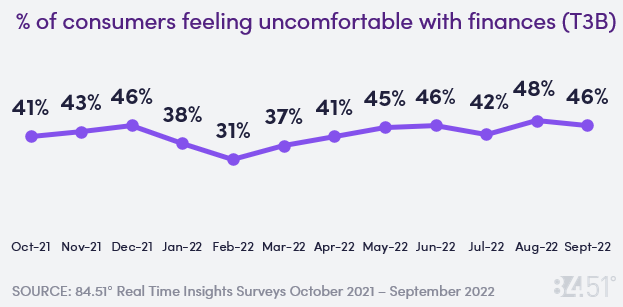
Concern for COVID, inflation and households' overall finances dropped off in September compared to last month, indicating some signs of stability.
46% of consumers are feeling uncomfortable with their finances this month, which is a slight decrease in concern compared to last month.
20% of shoppers are feeling concerned over COVID this month – the lowest concern we have seen. Daily average cases have declined in recent weeks with the 14-day change down by -28% as of Sept 10, 2022.
While concern over finances and inflation may be leveling off, 64% of households still report looking for sales/deals/coupons more, 54% are cutting back on non-essentials and 63% are cutting back in areas besides groceries (such as clothing or entertainment).
Gas prices also appear to be leveling off with the current average as of 9/8/2022 for regular at $3.75 compared to $4.06 a month ago.
How Customers are Responding to Inflation
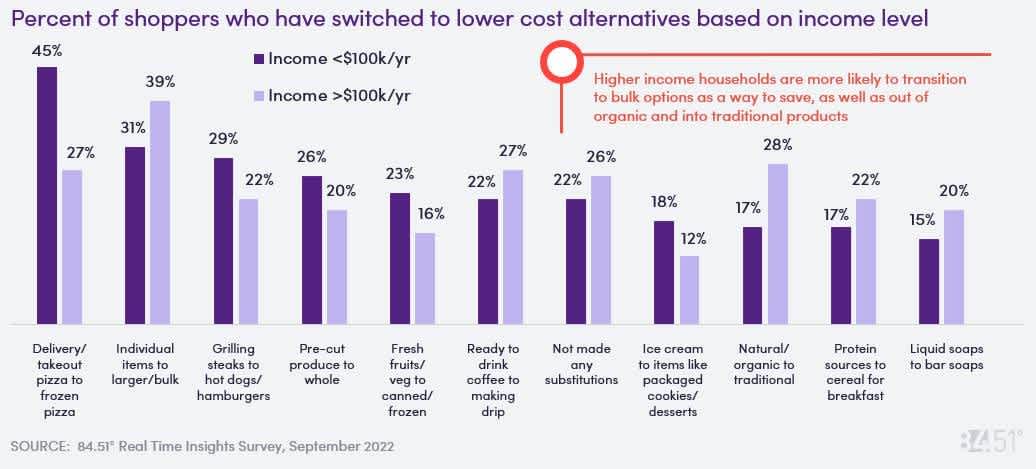
While behavior changes vary, 90% of shoppers acknowledge making changes due to grocery store price increases.
Most common behaviors include switching from delivery/takeout pizza to frozen pizza and shopping in bulk, but other behaviors are also starting to emerge, such as 16% of shoppers switching from liquid soap to bar soap and 12% of shoppers are switching from packaged chicken to rotisserie chicken.
Stirring the Coffee Cup: How to Stretch the Caffeinated Dollar
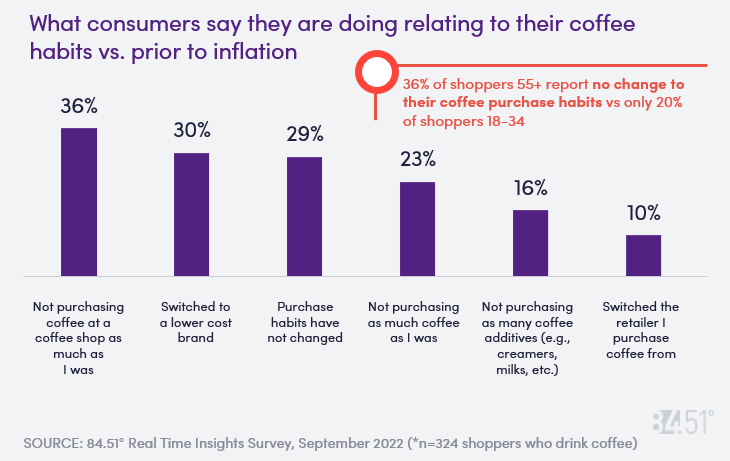
For the 81% of shoppers who drink coffee (19% of shoppers identify as non-coffee drinkers), what are the most common ways shoppers fill up their cups and how is this changing as inflation pressures continue?
The most common behaviors in the coffee category link to cut-backs at the coffee shop or switching to a lower cost brand, while about 1 in 4 say they are purchasing less.
The most popular coffee additives are Flavored Creamer (31%), Sugar (22%), Half & Half (17%) and Sweeteners (17%) while 13% say they do not put anything in their coffee.
Least common additives are milk and milk alternatives including Soy Milk (4%), Coconut Milk (4%), 1% Milk (5%) and Skim Milk (5%).
Growing Tastes for Plant-Based Alternatives
While some shoppers are purchasing plant-based alternatives for health reasons, others are approaching to save or because of the variety of options now available.
About half of respondents have engaged in plant-based alternatives either in the past or currently purchase them.
Engagement in plant-based does skew younger, as 59% of shoppers 18-34 have engaged in the category vs 40% of shoppers 55+.
There is no significant difference among income levels, as households making >$100K and those making <$100K are engaging in plant based at about the same levels.
Of the households that are maintaining or increasing their plant-based spend, the plant-based shopper is more likely to be female (62%), not have children (52%) and have an income <$100k (77%).
Household penetration of Plant Based Milk is 21% compared to 51% for Fluid Milk/White Milk. Oat Milk is the fastest growing sub-commodity within Natural Foods Plant Based Milk +46% in the L52W.
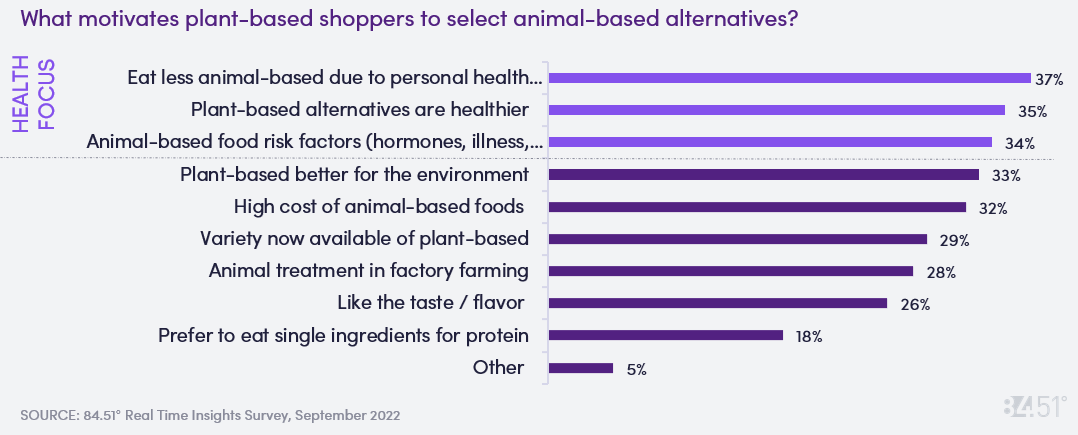
The top 3 reasons for why shoppers select animal-based alternatives link to health concerns, such as cardiovascular health, cancer or other health risks, such as food-borne illness.
Fall: Food, Fun and Football
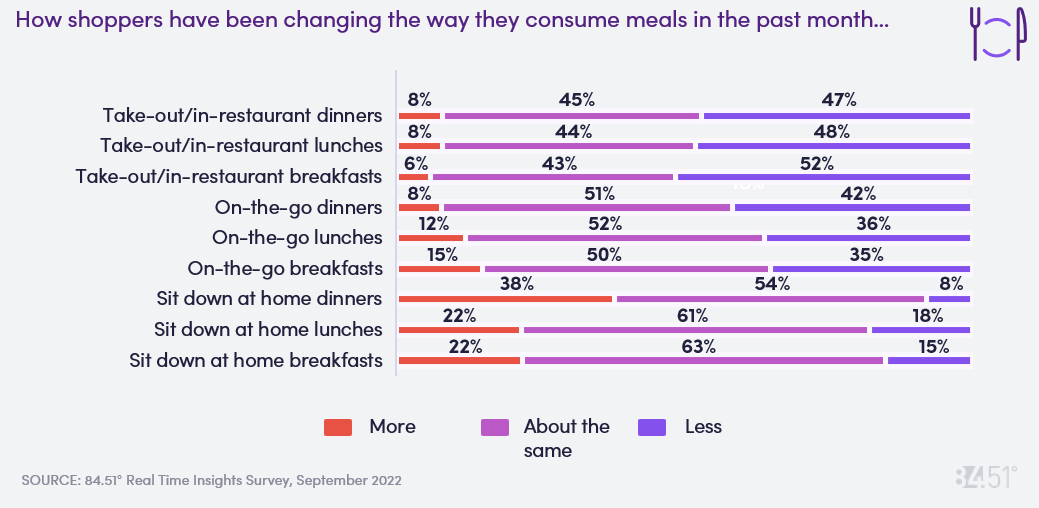
With summer coming to an end, many shoppers are beginning to plan fall activities, like football tailgating and Halloween, as well as changing the ways in which they plan and consume their meals.
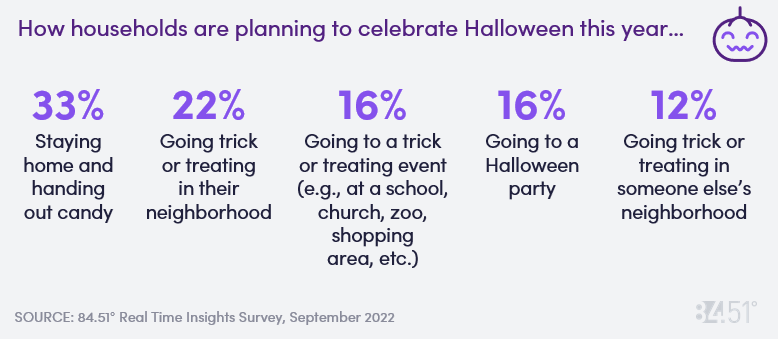
For those who are planning to celebrate Halloween this year many are looking to cut back in areas like:
Halloween decor (41%)
Candy (33%)
Costumes (24%)
Food for gatherings (23%)
Beverages for gathering (18%)
31% say they don’t plan to celebrate Halloween!
SOURCE: 84.51° Real Time Insights, September 2022
Visit our knowledge hub
See what you can learn from our latest posts.
