Consumer Digest: March 2024

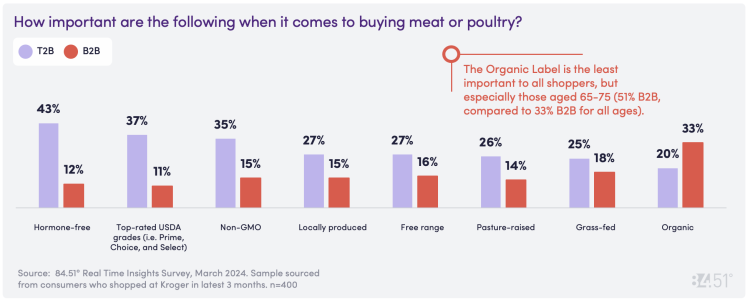
Welcome to the March Consumer Digest, where we provide relevant, informative and actionable insights around consumer trends. This month, we focus on consumers’ purchasing habits around protein needs, both plant-based and animal-based. We’ll look at how consumers are stretching their meat and protein dollar, what labels are important to them and sources of recipe inspiration. Finally, we’ll look at Easter plans and traditions.
How are shoppers feeling about inflation?
How comfortable are shoppers feeling regarding their finances?
Stretching the meat dollar
When asked about how they are stretching their dollar to fulfill their meat needs, shoppers are relying on discounts, changing the type of meat they purchase, and adjusting their meal plans.
Using sales/coupons/deals:
Buying more meals that are on sales, deal, or have coupons for: 66%
Stock up when on sale: 61%
Changing type of meat:
Purchasing cheaper cuts of meat: 37%
Switched from buying organic meals to non-organic: 10%
Adjusting meal plans:
Cook dishes that use less meat (e.g., casseroles, soups, tacos, etc.): 43%
Purchasing more beans, legumes, nut, eggs to replace some: 33%
Reduced protein consumption: 18%
Supplement with protein-based smoothies: 9%
I am not currently stretching my dollar or budget on meat: 12%
Proteins: The building blocks of life
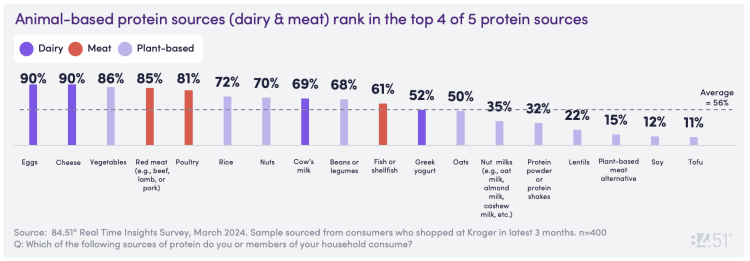
Shoppers include protein in their diets for a variety of reasons and leverage multiple food sources to achieve their protein consumption goals.
When it comes to including protein in their diets, shoppers are...
Most concerned with (T2B):
Good taste: 60%
Good value for the price paid: 55%
Keep me feeling full: 50%
Least concerned with (B2B):
Permitted by my religion: 61%
Plant-based protein: 45%
Accommodating multiple family members: 39%
Protein consumption has remained flat vs. last year with 66% of households reporting they are consuming about the same amount of protein, and 17% of households state that they are consuming less/more protein. For households who reported declining consumption, they claim that the cost of groceries is making it difficult for many people to afford.
My household is consuming...protein than a year ago
Same: 66%
More: 17%
Less: 17%
Shoppers predominantly purchase their protein sources at Grocery, Mass & Club stores
A grocery store: 92%
A mass retail store (Target, Walmart, etc.): 53%
A club store (Sam’s, Costco, etc.): 41%
A farmers' market: 13%
A specialty store like a meat market or butcher: 11%
An online retailer: 8%
Other: 1%
Plant-Based Consumption
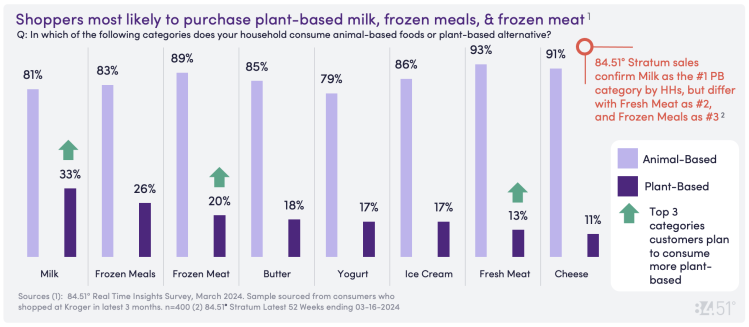
As shoppers seek better health and environmental stewardship, many turn towards plant-based alternatives to traditional meat and/or dairy foods. Often, shoppers “enter” plant-based with milk, then expand consumption to additional categories.
Drivers of plant-based consumption
What drives you to consume more plant-based?
Overall Health: 59%
Sustainability/Environment: 42%
Taste/Flavor: 38%
Animal Cruelty: 36%
What drives you to consumer less plant-based?
Cost: 53%
Less Sales/Promos: 41%
Texture: 24%
Taste/Flavor: 22%
Where do you find plant-based recipe inspiration?
Online Recipe Sites: 50%
Friends & Family: 35%
Cooking Shows/YouTube: 32%
Pinterest: 27%
The head of household is the main consumer of plant-based products among shoppers who purchase plant-based.
Who in your house consumes plant-based alternative food products?
Myself: 86%
Spouse/Partner: 41%
Kids: 25%
Other Adults in the Household: 12%
Shoppers who do not consume plant-based are not likely to try in the future.
How likely, if at all, are you to try plant-based alternative food products in the future?
Not Likely (B2B: 48%
Moderate (M3B): 47%
Very Likely (T2B): 5%
Easter Baskets – Who is eating the candy?
What do you plan on putting in your Easter basket?
Chocolate Candy: 57%
Fruit Flavored/Sugared Candies: 47%
Easter Themed/Limited Edition Candy: 36%
Peeps: 29%
Toys: 29%
Books: 20%
Money: 18%
Gift Cards: 17%
Gum/Mints: 15%
Greeting Cards 8%:
I do not celebrate Easter: 25%
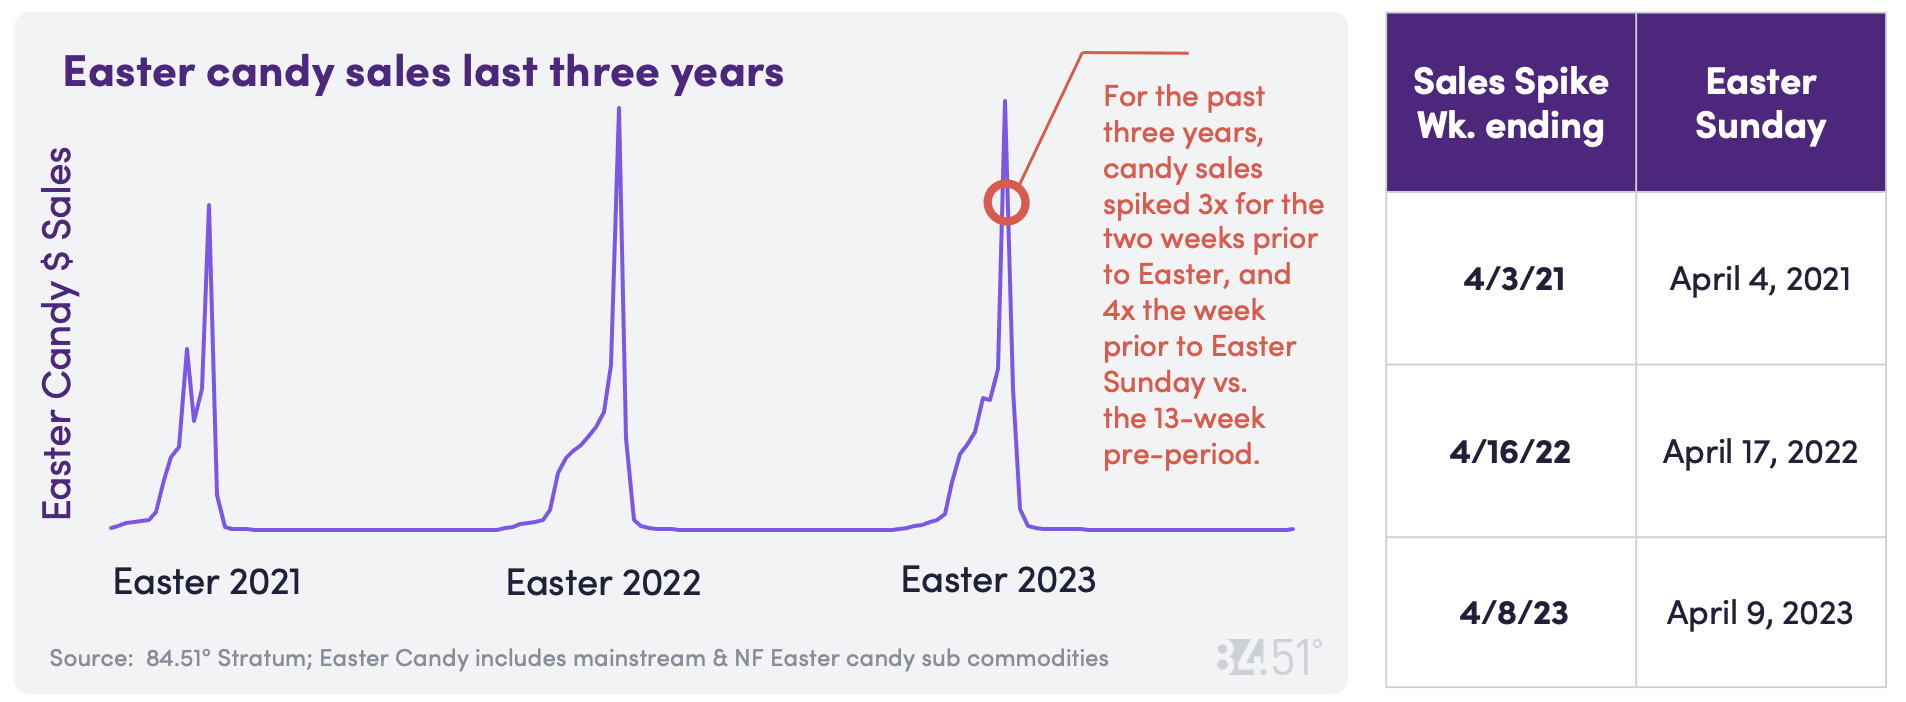
People wait until the “last minute” to buy Easter candy:
Top Easter Traditions for 2024:
BONUS: The Upcoming Solar Eclipse
On April 8th, a total solar eclipse will cross North America over many U.S cities from Maine to Texas. We asked how people will be celebrating this once-in-a-lifetime event.
Each month 84.51°’s Consumer Digest Report delivers relevant and actionable insights around consumer trends directly to your inbox. Now, for an incremental investment, 84.51° invites you to explore these insights the way you want via the 84.51° Consumer Digest Dashboard.
SOURCE: 84.51° Real Time Insights, March 2024
Visit our knowledge hub
See what you can learn from our latest posts.


