Consumer Digest: February 2022

Welcome to the February edition of the Consumer Digest, where we aim to provide relevant, informative and actionable insights around consumer trends and what consumers value. This month, we look at what consumers are doing to fight inflation, spring cleaning, what pandemic behaviors will “stick” and what consumers want when it comes to meal planning.
Finances, Inflation and What Consumers are Doing About it
Overall, consumers have some concern with their current financial state
Only 22% of consumers feel very comfortable with their current finances.
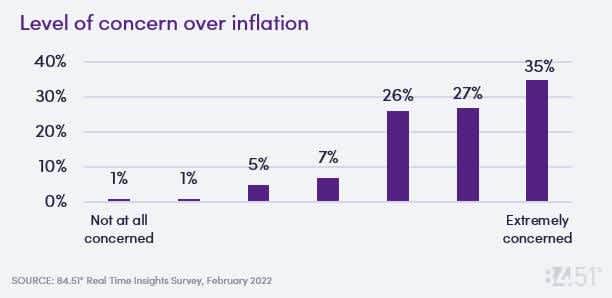
This is likely driven by the 62% who claim they are very concerned with inflation.
56% have been looking for sales and promotions more often.
40% say they have switched to a lower cost brand.
34% say they are cooking from home and 30% are going out less.
“Say vs. Do”
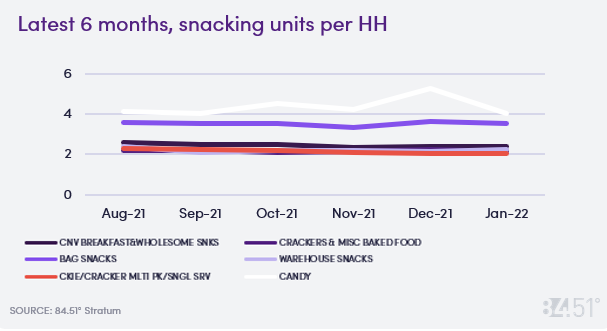
While 56% say they have been cutting back on non-essentials like snacks and candy, the actual shopper behavior shows that units are flat over the past 6 months except for the “candy holiday” peaks.
Cost Cutting and Premiumization
89% of consumers are noticing higher prices in the meat and seafood categories and nearly 80% are seeing rising prices in produce and dairy.
The top categories consumers say they would cut are adult beverages (57%), snacks (56%) and beauty (46%).
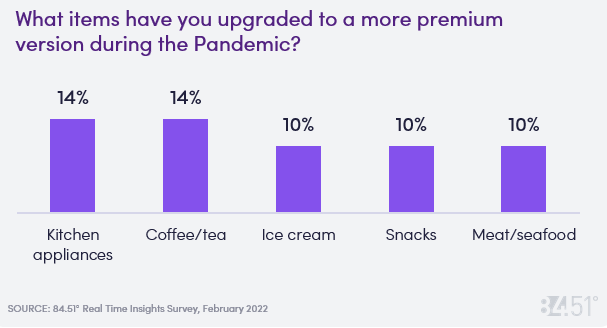
During the pandemic, some categories experienced a shift to a more premium version, perhaps to add small indulgences to their lives.
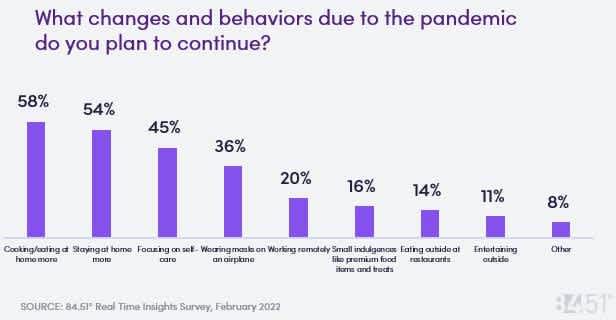
Behaviors that will “Stick”
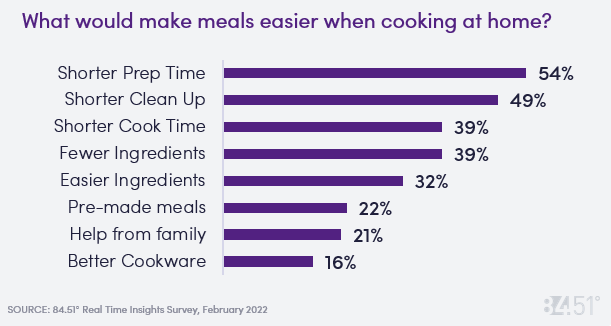
Meal Planning Goals: Speed and Simplicity
40% of consumers use their own cookbooks and recipes to plan their meals.
However, many search for inspiration. Consumers google search (35%), use store ads
(33%), use online sites like Pinterest (21%), and use apps
on their phone (14%).
Some consumers stick to their routine (20%) or are more spontaneous and don’t plan their meals (18%).
Spring is in the Air – on the Floor, and the Bathrooms!
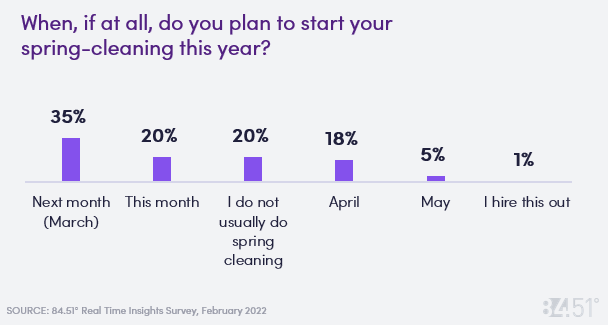
35% of consumers are planning to start their spring-cleaning next month (March). While 20% of consumers are planning to do their spring-cleaning this month, the same percentage does not usually do spring cleaning.
The top items consumers plan to purchase to help with their spring-cleaning are all purpose cleaner (75%), bathroom cleaners (69%), toilet cleaners (67%), and glass cleaner (64%).
Visit our knowledge hub
See what you can learn from our latest posts.
