Consumer Digest: August 2022

Welcome to the August edition of the Consumer Digest, where we aim to provide relevant, informative and actionable insights around consumer trends. This month, we're highlighting recent customer trends around the continued impact of inflation. We're also taking a deep dive into "shrinkflation" and what households with children are feeling and doing.
Shopper Concern – The Highs and Lows
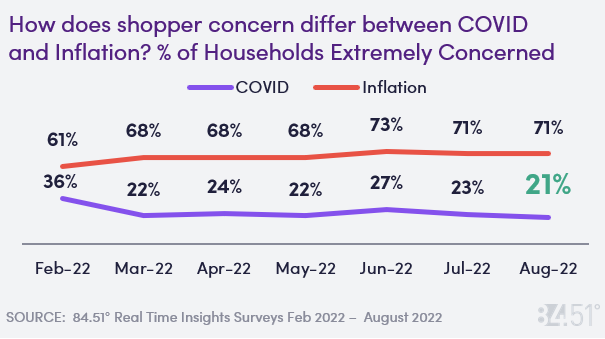
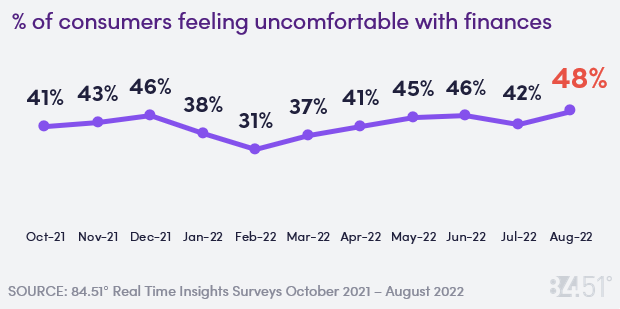
While shoppers' concern over COVID is at an all-time low, their concern over finances is at an all-time high.
48% of consumers are feeling uncomfortable with their finances this month – this is the highest concern we have seen since October of 2021.
While concern over inflation/consumer prices was similar to what we saw last month, those ages 55-74 had a significantly higher amount of concern compared to those ages 18-54.
The US Bureau of Labor Statistics reported that CPI (Consumer Price Index) for all items was unchanged in July. Current U.S. avg. for a gallon of regular gas is ~$3.90 vs. ~$4.67 a month ago.
21% of shoppers are feeling concerned over COVID this month – the lowest concern we have seen. Daily reported case counts in August are slightly declining from numbers seen in July. The CDC reported ~126,626 cases on August 1st vs. ~1,263,224 cases reported back on January 10th of this year.
How Consumers Are Coping With Rising Prices
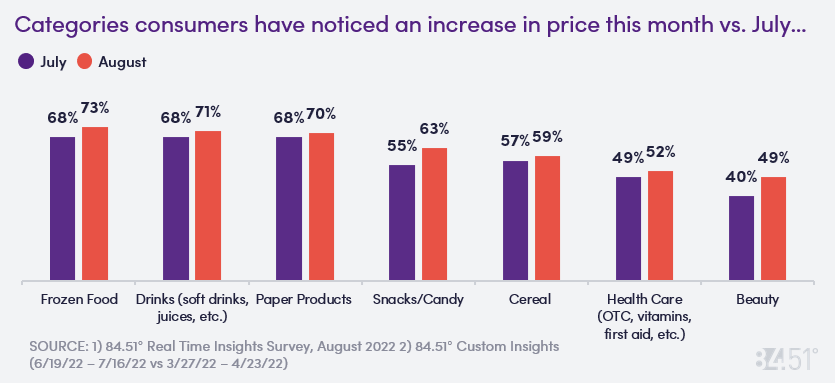
Shoppers continue to notice high prices across many grocery categories. Many are adapting how they shop and what they purchase as a result of price increases.
38% of consumers say they are shopping less frequently than they normally do for groceries as a result of high prices. 43% say they are purchasing fewer items during their grocery trips.
This month, 50% say they have switched to a lower cost brand vs. 46% from July. Shoppers say they would be willing to switch to a lower cost brand in categories such as paper products (59%), shelf-stable items like canned goods, pastas, etc. (53%), and household cleaning (52%).
While 84% of consumers say they have seen an increase in price in Dairy (milk, cheese, etc.), only 18% mention they have been cutting back in that category.
‘Shrinkflation’ – Are Shoppers Noticing?
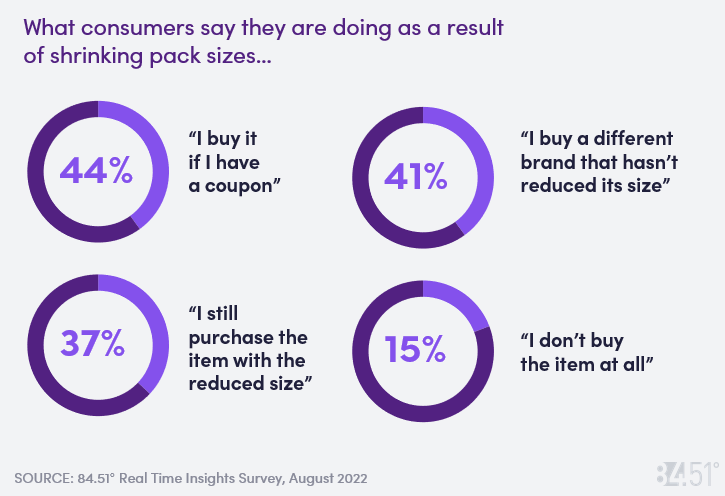
When asked which categories consumers have noticed shrinking pack sizes, 51% mentioned Chips, 37% mentioned Cereal, 29% mentioned Candy Bars, and 26% mentioned Toilet Paper.
High Price Sensitive shoppers are significantly more likely to notice shrinking pack sizes.
27% of shoppers say they have not noticed any categories that are shrinking their pack sizes.
Double Click: Let’s check in on Households with Children
This month we took a deeper look at households with children given that trends have shown limited variance month over month for total households. Households with kids are, of course, larger in size (in terms of mouths to feed) and account for a large total % of sales across the Kroger enterprise and 4X the sales of HHs with no children over the past four weeks. This deeper dive enables us to dial in tighter and uncover actionable learnings.
% households with children preparing to celebrate fall festivities, notably more so than households without children:
Halloween: 85% vs. 63% HHs w/o kids
Football/Tailgating: 82% vs. 63% HHs w/o kids
Labor Day: 58% vs. 43% HHs w/o kids
Back to School Events: 47% vs. 13% HHs w/o kids
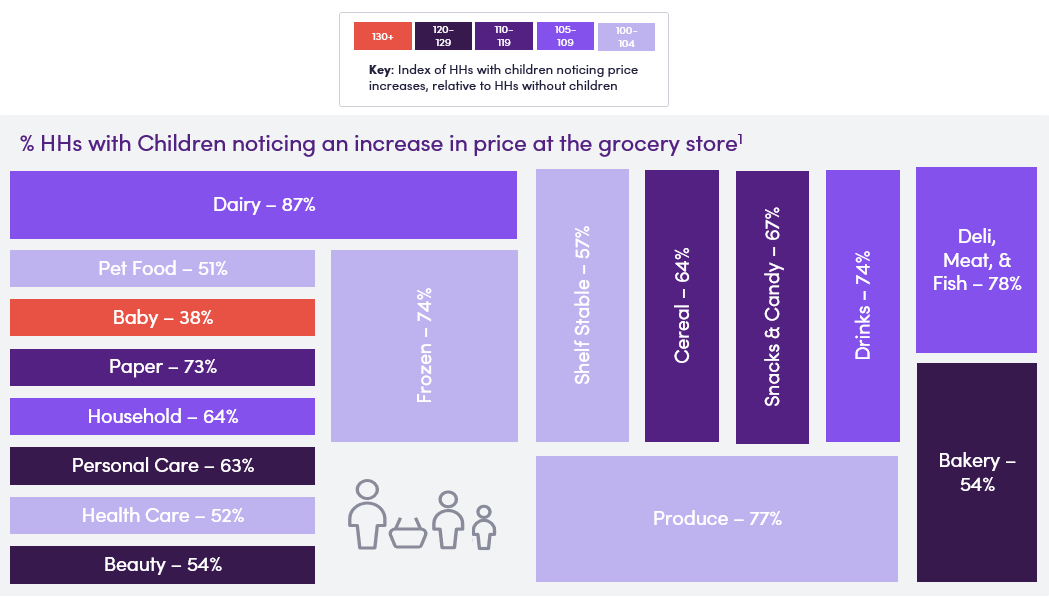
While households with children are more apt to celebrate across all seasonal occasions, they are also facing inflation constraints – balancing revelry with affordability. Households with children notice price increases more than households without children in every single department.
While HHs with kids have a higher perception of increase in price (vs. HH without kids in the house), they are not cutting back any more drastically than HHs without kids.
In response to inflation, HHs with children are enjoying cooking more and are cooking more from scratch than in July. While they are not cutting back on groceries more than HHs without children, they are celebrating seasonal moments – and perhaps bringing more homemade enjoyment with them.
Enjoying Cooking More: 28% HH w Kids vs. 18% HH w/o kids
Cooking from Scratch More: 36% HH w Kids vs. 29% HH w/o kids
SOURCE: 84.51° Real Time Insights, August 2022
Visit our knowledge hub
See what you can learn from our latest posts.
